Global Warming Truth-Home » Environmental-tv-movies » Unofficial transcription of 'An Inconvenient Truth'-Part 1
»
|
||
Unofficial transcription of 'An Inconvenient Truth'-Part 1
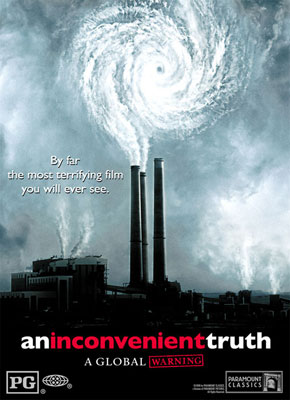 Please note: I have no connection to Al Gore or the makers of the movie. Aside from the titles and pictures, the following text is an unofficial transcript of the movie, "An Inconvenient Truth".
In TouchYou listen to a river gently rolling by. Earth Rise
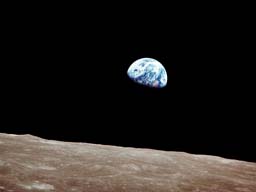
This is the first picture of the Earth from space that any of us ever saw. It was taken on Christmas Eve 1968 during the Apollo 8 mission. More...In relatively comfortable boundaries... But we are filling up that thin shell of atmosphere with pollutants. I'm Al Gore. I used to be the next president of the United States. I've been trying to tell this story for a long time and I feel as I've failed to get the message across. I was in politics for a long time. I'm proud of my services. (Mayor of New Orleans in background). There are good people who are in politics who hold this at arm's length because they acknowledge it and recognize it as a moral imperative to make big changes . And they lost radio contact when they went around to the dark side of the moon and there was inevitably some suspense. Then when they came back in radio contact they looked up and snapped this picture and it became known as Earth Rise. And that one picture exploded in the consciousness of the human kind. It led to dramatic changes. Within 18 months of this picture the modern environmental movement had begun.
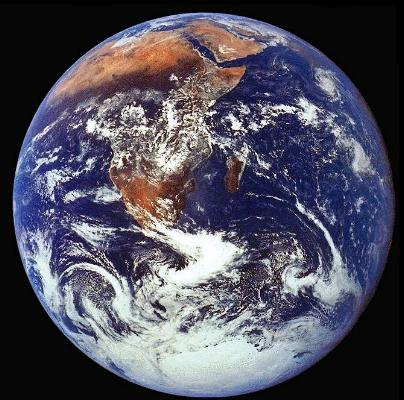
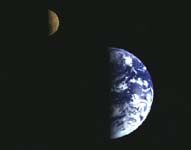
The next picture was taken on the last Apollo mission, Apollo 17. This one was taken on Dec. 11, 1972 and it is the most commonly published photograph in all of history. And it is the only picture of Earth from space that we have where the sun was directly behind the spacecraft so that the Earth is fully lit up, and not partly in darkness.
The next I'm going to show you has almost never been seen. It was taken by a spacecraft called the Galileo that went out to explore the solar system. As it was leaving Earth's gravity it turned its cameras around and took a time lapsed picture of one day's worth of rotation here compressed into 24 seconds. Isn't that beautiful? This image is a magical image in a way. It is made by a friend of mine, Tom Dan San(sp?). He took 3000 separate satellite pictures taken over a 3 year period, digitally stitched together. He chose images that would give a cloud free view of every square inch of the earth's surface. All of the land mass is accurately portrayed. When that is spread out it becomes an iconic image. The Most Ridiculous ThingI show this because I want to tell you a story about two teachers I had, one that I did not like that much, the other who was a real hero to me. I had a grade school teacher who taught geography by pulling a map of the world down in front of the blackboard. I had a classmate in the sixth grade who raised his hand and he pointed to the outline of the east coast of South America, and he pointed to the west coast of Africa, and he asked, "Did they ever fit together?" And the teacher said, "Of course not! That's the most ridiculous thing I've ever heard." That student went on to be a drug addict and a ne'er do well. That teacher went on to be a science advisor in the current administration. But you know, the teacher was actually reflecting the conclusion of the scientific establishment at that time: "Continents are so big that obviously they don't move." But actually as we now know they did move. They moved apart from one another, but at one time they did in fact fit together. But that assumption was a problem. It reflected the well known wisdom: "What gets us into trouble is not what you don't know, but what you think you know that just ain't so." This is actually an important point, believe it or not because there is another such assumption that a lot people have in their minds right now about global warming that just isn't so. The assumption goes like this: "The world is so big is that we can't possibly have any lasting, harmful impact earth environment." Maybe that was true at one time, but it is not true any more. One of the reasons it is not true anymore, because one of the most vulnerable parts is the atmosphere vulnerable because it's so thin. My friend the late Carl Sagan used to say that if you have a globe with a thin coat of varnish on it, the thickness of that varnish relative that globe is pretty much the same as the thickness of the earth's atmosphere compared to the earth itself. It is thin enough that we are capable of changing its composition.
That brings up the basic science of global warming. I'm not going to spend a lot of time on this because you know it well. The sun's radiation comes in the form of light waves and heats up the earth. Some of The radiation that is absorbed and warms the earth is re-radiated back into space in the form infrared radiation. Some of the outgoing infrared radiation is trapped inside the atmosphere. That is good thing because it keeps the temperature of the earth within certain boundaries, keeps it relatively constant and livable. But the problem is that this thin layer of atmosphere is being thickened by all of the global warming pollution that is being put up there. What that does is it thickens this layer of atmosphere. More of the outgoing infrared is trapped. So the atmosphere heats up worldwide. Carbon Dioxide LevelsThis is the image that started me in my interest in this issue. I saw it when I was a college student because I had a college professor named Roger Revelle who was the first person to have the idea to measure the amount of carbon dioxide in the earth's atmosphere. He saw where the story was going. After the first few years of data, he intuited what is meant, for what is yet to come. They designed the experiment in 1957. He hired Charles David Keeling who was very faithful and precise in making these measurements for decades. They started sending these weather balloons every day. They chose the middle of the Pacific because it was the area that was the most remote. He was a very hard nosed scientist. He really liked the hard data. It was a wonderful time for me, because, like a lot of young people, I came into contact with intellectual ferment, ideas that I'd never considered in my wildest dreams before. He showed our class the result of these measurements after only a few years. It was startling to me. He was startled and he made it clear to our class what he felt the significance of it was. I soaked it up like a sponge. He drew the connection between the larger changes in our civilization and this pattern that was now visible in the atmosphere entire planet. He projected into the future where this was headed unless we made some adjustments and it was as clear as day. After the first seven, eight, or nine years you can see the pattern was developing. But I had to question why does it go up and down once each year? He explained that if you look at the land mass of the earth, very little it is south of the equator. The vast majority of it is north of the equator. And most of the vegetation is north of the equator. When the northern hemisphere is tilted toward the sun as it is in our spring and summer, the leaves come out and they breathe in the carbon dioxide and the amount in the atmosphere goes down. When the northern hemisphere is tilted away from the sun as it is in our fall and winter, the leave fall down and exhale the carbon dioxide and the amount in the atmosphere goes up again. It's as if the entire earth once each year breathes in and out.
Political JourneyWhen I went to the Congress in the middle 1970's I helped organize the first hearings on global warming, I asked my professor to be the lead off witness. I thought that would have such a big impact we'd be well on the way to solving this problem, but it didn't work out that way. I kept having hearings, and in 1984 I went to the Senate and really dug deeply into this issue with science round tables and the like. I wrote a book about it. I ran for president in 1988 partly try to gain some visibility for this issue. In 1992 went to the Whitehouse. We passed a version carbon tax and some other measures to try to address this. I went to Kyoto in 1997 to help get a treaty that is so controversial, in the US at least. In 2000 my opponent pledged to regulate the CO2 and that was not a pledge that was kept. The point of this is all this time you can see what I have seen all these years. It just keeps going up. It is relentless. Effects of Global Warming
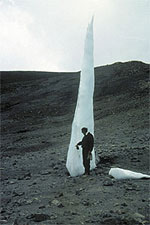
Ice Cores: The 650,000 RecordThere is a message in this. It is worldwide. The ice has a story to tell and it is worldwide. My friend Lonnie Thompson digs cores in the ice. They dig down and they bring the core drills back up and they look at the ice and they study it. When the snow falls it traps little bubbles of atmosphere. They can go in and measure how much CO2 was in the atmosphere the year that snow fell. What's even more interesting I think is they can measure the different isotopes of oxygen and figure out the very precise thermometer and tell you what the temperature was the year that bubble was trapped in the snow as it fell. When I was in Antarctica I saw cores like this and the guy looked at it. He said right here is where the US Congress passed the Clean Air Act. I couldn't believe it but you can see the difference with the naked eye. Just a couple of years after that law was passed, it's very clearly distinguishable. They can count back year by year the same way a forester reads tree rings. You can see each annual layer from the melting and refreezing. They can go back in a lot of these mountain glaciers a thousand years. They constructed a thermometer of the temperature. The blue is cold and the red is warm. I show this for a couple of reasons. Number one the so called skeptics will sometimes say "Oh, this whole thing is cyclical phenomenon. There was a medieval warming period after all." Well yeah there was. There it is right there. There are one there and two others. But compared to what is going on now, there is just no comparison. So if you look at a thousand years worth of temperature and compare it to a thousand years of CO2 you can see how closely they fit together. Now, a thousand years of CO2 data in the mountain glacier. That is one thing. But in Antarctica, they can go back 650,000 years. This incidentally is the first time anybody outside of a small group of scientists have seen this image. This is the present day era and that's the last ice age. Then it goes up. We're going back in time now 650,000 years. That's the period of warming between the last two ice ages back. That's the second and third ice age back. CO2 Concentration Is Above 300 PPM
This is really not a political issue so much as a moral issue. If we allow that to happen, it is deeply unethical. I have such faith in our democratic system, our self-government, I actually thought and believed that the story would be compelling enough to cause a real sea change in the way Congress reacted to that. I thought they would be startled and they weren't. 'An Inconvenient Truth' transcription continued here... |
|
|
